

Supporting Article (W1-S1-A7 · 6 of 6) | Reading Food Labels for Macronutrients: A Practical Guide
1. Why the Nutrition Facts Label Matters
The Nutrition Facts panel is the most direct tool you have for understanding what a packaged food actually contains. Despite this, most people find labels harder to interpret accurately than they expect — not because the information is hidden, but because several features of how labels are formatted make it easy to misread them.
For macronutrient goals specifically — whether you are tracking protein intake, managing carbohydrate quality, or monitoring fat consumption — understanding how the panel is organized and what its numbers actually represent makes your dietary choices more informed and more accurate.
Macronutrients are the three main energy-providing nutrients: protein, carbohydrates, and fat. For a foundational explanation of what each one does and how they work together, see the macronutrients overview.
2. How the Nutrition Facts Panel Is Organized
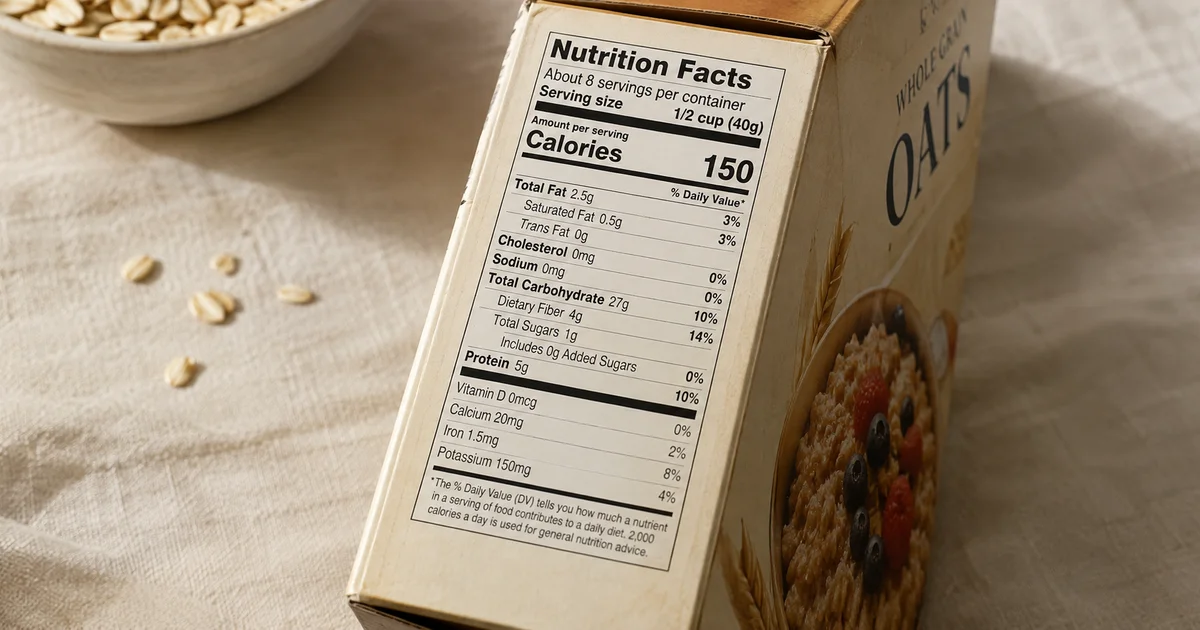
The Nutrition Facts panel follows a standardized layout in the United States (updated in 2016 under FDA regulations), with the most important contextual information at the top and macronutrient details below. Reading it top to bottom in this order — serving size first, then calories, then macronutrients — prevents the single most common error: applying per-serving values to amounts you did not actually consume.
Check the serving size first, note servings per container, then multiply per-serving macronutrient figures by what you will actually eat. Skipping this sequence is the primary source of label-based tracking error.
3. Serving Size: The Number That Changes Everything
The declared serving size — the first line of every Nutrition Facts panel — determines what all the values below it actually mean. Every macronutrient figure, every calorie count, and every % Daily Value is for that serving size, not for the entire package.
Serving sizes are set by FDA regulatory standards as reference amounts, not as recommendations for how much to eat or as descriptions of typical consumption. A 2-ounce serving size on a chip bag is a standard reference amount; it may bear no relationship to how much most people eat in a sitting.
The practical implication: before reading any other line on the panel, check the serving size and the number of servings per container. If the container holds two servings and you eat the whole thing, double every value. This single step prevents most of the systematic underestimation that makes label-based tracking inaccurate.
FDA-declared serving sizes are standardized reference amounts — they define what the label values apply to, not how much anyone should eat. Per-serving macronutrient figures must be multiplied by actual servings consumed to reflect real intake.
4. Protein: What the Label Shows
The protein line on a Nutrition Facts panel reports total protein in grams per serving. This includes both animal and plant protein from whatever ingredients are in the product.
A few things the protein line does not show: – Protein quality. The panel does not indicate amino acid completeness or digestibility. A gram of protein from a mixed-grain cracker and a gram from a chicken breast carry the same number on the label but are nutritionally distinct. – % Daily Value. Under current FDA regulations, a % Daily Value for protein is only shown on food labels when a protein claim is made. In most cases, the label shows only grams.
For practical use, the gram figure is sufficient when you are tracking total daily protein intake. The quality distinction matters more for dietary pattern planning than for single-food comparison.
5. Carbohydrates: Total, Fiber, and Added Sugars
The carbohydrate section of the Nutrition Facts panel has more lines than any other macronutrient, reflecting the meaningful nutritional distinctions within the category.
Total Carbohydrate is the sum of all carbohydrates in the serving: digestible starches, naturally occurring sugars, added sugars, and dietary fiber.
Dietary Fiber appears as the first indented subitem under Total Carbohydrate. Fiber is a carbohydrate that resists digestion and carries its own health effects — for a full explanation of what the research shows about fiber and how to get enough, see Fiber: Why It Matters and How to Get Enough.
Total Sugars includes both naturally occurring sugars (in fruit, dairy, and some vegetables) and added sugars.
Added Sugars — a separate line added with the 2016 FDA label update — distinguishes sugars added during manufacturing or preparation from those occurring naturally in ingredients. This distinction matters for dietary quality assessment: naturally occurring sugars in a plain yogurt or fresh fruit come with protein, fiber, or other nutrients; added sugars typically do not.
When comparing similar products, the fiber subline and added sugars line are often more useful than the total carbohydrate figure alone.
6. Fats: Total, Saturated, and Trans
The fat section of the Nutrition Facts panel reports total fat in grams per serving, with saturated fat and trans fat broken out as subitems.
Total Fat includes saturated fat, trans fat, and unsaturated fats (both monounsaturated and polyunsaturated). Unsaturated fats are not separately itemized on the standard label.
Saturated Fat appears as the first indented item. This is the subtype with the most consistent cardiovascular research attention — higher saturated fat intake is associated with higher LDL cholesterol levels in metabolic studies.
Trans Fat is listed separately. Industrial trans fats (created by partial hydrogenation) have the least favorable cardiovascular profile of any fat type, and most US food manufacturers have phased them out following FDA regulatory action. A label showing 0 g trans fat may still contain up to 0.5 g per serving without disclosure — checking the ingredient list for “partially hydrogenated oil” is the definitive test.
7. Putting the Label in Context
Nutrition Facts panels are useful for single-food assessment and comparison, but the number that matters most for dietary quality is not any individual label figure — it is the cumulative pattern across your meals.
A food scoring well on its label is not necessarily a good dietary choice if it is highly processed, calorically dense, or low in satiety-promoting fiber and protein relative to its size. The label tells you what is in one serving; your overall dietary pattern determines whether it is well-placed.
Fiber is one of the most useful single-label data points for comparing products quickly: a cereal with 5 g fiber per serving and a cereal with 1 g fiber per serving are genuinely different from a gut health and satiety standpoint, even if their total carbohydrate figures are similar. For more on what the research shows about fiber’s effects, Fiber: Why It Matters and How to Get Enough covers the evidence in detail.
% Daily Values are calculated against a 2,000 kcal/day reference intake and are most useful for comparing products or identifying nutrient-dense foods. A value ≤5% is generally low; ≥20% is high. They are benchmarks for comparison, not personal daily targets.
8. Where This Fits Into the Bigger Picture
Understanding food labels turns macronutrient science into daily practice. The label is the interface between nutrition knowledge and food selection — what you learned from understanding how macronutrients work is most actionable when you can see, accurately, what a food actually contains.
For protein specifically, knowing how to read the label is only useful alongside knowing how much protein you actually need. How Much Protein Do You Actually Need? covers the research-backed ranges for different life stages and activity levels.
For the full picture of how protein, carbohydrates, and fat work together — including what each macronutrient does and how they interact — What Are Macronutrients: Protein, Carbohydrates, and Fats Explained is the foundational reference.
9. Frequently Asked Questions
How do I use a Nutrition Facts label to track macronutrients accurately?
Start with the serving size, and determine how many servings you will consume. Multiply the per-serving gram figures for protein, total carbohydrate, and total fat by that number. The % Daily Values are less useful for this purpose since they are based on a 2,000-calorie reference that may not reflect your intake.
Is total carbohydrate or net carbohydrate the right number to use?
It depends on your goal. Total carbohydrate includes dietary fiber, which contributes minimally to blood glucose. “Net carbs” (total carbohydrate minus fiber) is a calculation sometimes used by people monitoring glycemic response; it is not a regulated label term. For general macronutrient tracking, total carbohydrate is the standard figure.
Why do some products show 0 g trans fat but still list partially hydrogenated oil?
FDA regulations allow a product to list 0 g trans fat when the amount per serving is below 0.5 g. If the product has a small serving size relative to typical consumption, actual trans fat intake can be meaningful even at labeled values of zero. Checking the ingredients list for “partially hydrogenated oil” is the only reliable test.
What does the % Daily Value tell me?
% Daily Values show what proportion of a 2,000-calorie-per-day reference intake each nutrient provides per serving. A value of 5% or less is generally considered low; 20% or more is considered high. These percentages are most useful for comparing products or assessing whether a food is concentrated in a particular nutrient — they are reference points, not personal targets.
References
- Cowburn, G., & Stockley, L. (2005). Consumer understanding and use of nutrition labelling: a systematic review. Public Health Nutrition, 8(1), 21–28.
- Institute of Medicine. (2005). Dietary Reference Intakes for Energy, Carbohydrate, Fiber, Fat, Fatty Acids, Cholesterol, Protein, and Amino Acids. The National Academies Press.
This article was drafted with AI assistance and reviewed and approved by The Psychanatomy Editorial Team before publication.

